I have reproduced this excellent article Gradient Factors explained by Matti Anttila in case the original website goes down. It is published here for educational purposes.
Remember your first diving classes and the lesson about bubbling soda bottle and too rapid ascents? No matter how deeply you study the decompression theory, this soda bubble analogy is still valid. However, it’s time to introduce some more fundamentals of the issue. But let’s start from the history:
Sponsored Link
DECOMPRESSION THEORY HISTORY
Decompression theory is a relatively old science. Already in late 1800’s, French physiologist Paul Bert (1833-1886) discovered decompression sickness and the need for decompression stops and slow ascend speed.
Paul Bert
Bert also studied the effects of oxygen to the humans, as he was more interested in the physiological effects of mountaineering and hot air ballooning. He also extended his studies to cover high pressure environments, and found out later about oxygen toxicity.
Bert made a conclusion that high oxygen partial pressures affect humans chemically, not mechanically, as he described the causes of Central Nervous System (CNS) oxygen toxicity.
When Bert studied air and nitrogen, he correctly determined the cause of the Decompression Sickness (DCS) to be caused by the nitrogen bubbles in the blood and other tissues (mechanical effects). Bert also did experiments on recompression therapy and oxygen administration in DCS cases.
The most famous of Bert’s books is “La Pression barometrique” 1 , published in 1878, which dealt with the human physiology in low and high air-pressures.
John Scott Haldane
While Bert laid the fundamentals to the decompression studies, it was John Scott Haldane (1860-1936), a Scottish physiologist who approached the problem of decompression theory with more scientific approach.
In 1905, Haldane was appointed by the Royal Navy to perform research about Navy’s diving operations. His focus was to study the decompression sickness and how it could be avoided.
Haldane performed several tests and studied the effects of compressed air at depth, and in 1908 he published the results of his tests in the Journal of Medicine 2. This article also contained his diving tables.
Haldane is considered to be the father of modern decompression theory. In his research, he made an important conclusion that a diver could surface from an indefinitely long 10m/33ft dive without DCS.
From this result, he determined that human body could tolerate pressure change with a factor of 2:1 (the pressure in 10m/33ft is 2 ATA, while on surface it is 1 ATA). Later this number was refined to be 1.58:1 by Robert Workman.
Robert Workman
Workman was an M.D. and decompression researcher in U.S. Navy during 1960’s. He studied systematically the decompression model that was used in the U.S. Navy and which was then based on Haldane’s research.
In addition to refining the tissue pressure ratio, Workman found out that the ratio varied by tissue type (hence the term “tissue compartment” or TC, representing different half-times, e.g. speed of gas dissolving) and depth.
Dr. Albert A. Bühlmann
Dr. Albert A. Bühlmann (1923-1994) from Zürich developed decompression theory further. During his long research career, he extended the number of tissue compartments to 16, which was the basis of his ZH-L16 decompression model (“ZH” as Zürich, “L” as Linear and “16” for the number of TCs).
The first set of ZH-L16 tables was published in 1990 (previous tables 3, published earlier, contained smaller amount of TCs).
DECOMPRESSION THEORY BASICS
Let’s start from basics: A diver goes down and breathes compressed air from his/her cylinder. Air contains nitrogen, which, as an inert gas, dissolves into the diver’s tissues.
When the diver starts ascending, the ambient pressure decreases and dissolved nitrogen transfers from other tissues to the blood, from there to the lungs, and finally leaves the body with each exhale cycle. Simple as that, is it?
In recreational diving, no decompression dives are being conducted. Divers are told to stay within their no-decompression limits (NDL) of bottom time. This NDL is shown in diving tables, and besides that, divers must stay within a certain ascent speed.
This information is generally enough for most divers, but what happens when we exceed the NDL and start accumulating decompression time?
TISSUE SATURATION AND ASCENT CEILING
When we dive, we always have an invisible ceiling above us. This ceiling is a depth, which we can ascend to without getting DCS symptoms (generally speaking). The ceiling is based on the amount of dissolved inert gas in our tissues.
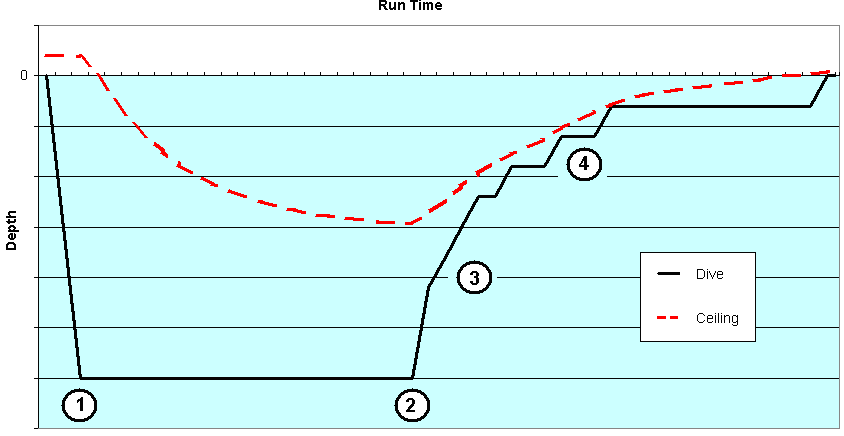
Figure 1 (below) represents a typical decompression dive profile with multiple decompression stops. Before the dive, your “ceiling” is in fact negative depth (above surface), meaning that your tissues could tolerate certain overpressure gradient.
As the run time increases and diver spends time at the bottom, the ceiling depth goes down and starts limiting the ascent possibilities, generating the need for decompression.
In fact, some decompression software indicates the ceiling depth when user types in the desired dive levels. Diving computers indicate the ceiling as the deepest required decompression depth.
Figure 1: A typical decompression dive profile with ceiling line visible. Numbers represent different phases (see phases also in Figure 2).
When the ascent starts, the diver can not ascend above the ceiling without risking the possibility of decompression sickness. The decompression stops are clearly visible in the dive profile in Figure 1. The closer one goes to the ceiling, the less margin of safety remains.
The ceiling depth does not yet indicate on-gassing or off-gassing. Bühlmann used 16 tissue compartments to model inert gas dissolving in our body. These compartments either take more dissolved gas in (on-gassing) or expel dissolved gas out (off-gassing).
The ceiling depth indicates the pressure change from current depth, in which the leading compartment off-gasses so fast, that further increased pressure drop would risk the possibility of DCS.
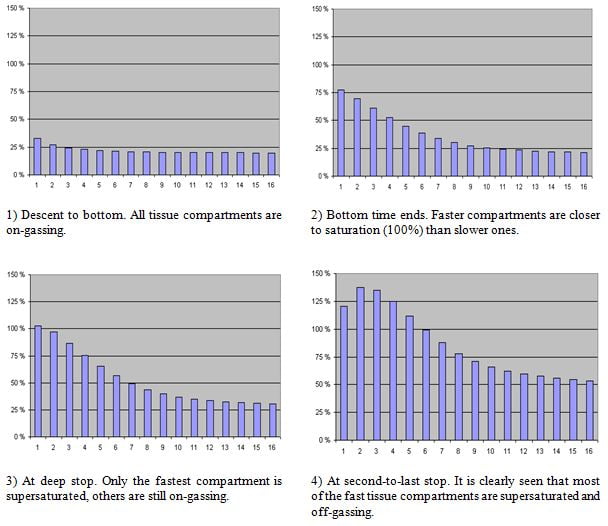
Figure 2 illustrates these 16 tissue compartments during the dive, presented in Figure 1. A tissue compartment (TC) has reached its saturation point when it is 100% full.
During the ascent phase, a TC can go supersaturated (exceeds 100%). The key of the decompression is to be supersaturated, but not so much that the dissolved gas would form excess bubbles to our tissues and blood.
Figure 2: An example of inert gas loading in tissues. Pressure in tissue compartment is indicated as percents, 100% being ambient pressure.
As shown, the amount of dissolved gas, or specifically the partial pressure of the dissolved inert gas in our tissues, tends to follow the ambient pressure in which we are during the dive.
The bigger the pressure difference (i.e. pressure gradient), the faster the gas dissolves, in both directions.
This leads to an obvious question: Why not just come up? What are the limits of supersaturation, and how are they defined?
Sponsored Link
M-VALUES
Back to the history: Robert Workman introduced the term M-value, which means Maximum inert gas pressure in a hypothetical tissue compartment which it can tolerate without DCS.
As mentioned, Haldane found out in his research that M-value is 2, and Workman refined it to be 1.58 (this number comes from pressure change from 2 ATA to 1 ATA, and taking into account that air has 79% inert gases, mainly nitrogen).
Workman determined the M-values using depths (pressure values) instead of ratios of pressure, which he then used to form a linear projection as a function of depth. The slope of the M-value line is called ?M (delta-M) and it represents the change of M-value with a change in depth (depth pressure).
Bühlmann used the same method than Workman to express the M-values, but instead of using the depth pressure (relative pressure), he used absolute pressure, which is 1 ATA higher at depth.
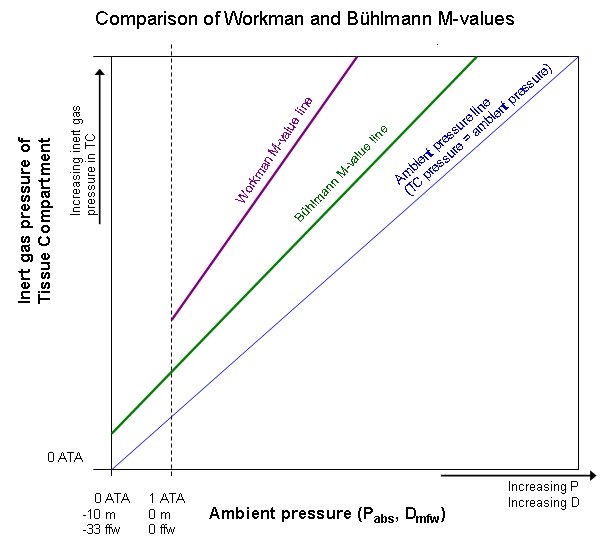
This difference is shown in Figure 3, where Workman’s M-value line goes above Bühlmann’s M-value line.
Figure 3: Comparison of different M-value lines.
Figure 3 shows a comparison between Workman and Bühlmann M-value lines. A more detailed explanation can be found in literature 4, but it is easy to spot the greatest differences: while Workman M-value line is steeper than Bühlmann M-value line, there is also less margin for safety.
Workman M-values also allow higher supersaturation than Bühlmann’s.
To make things a bit more complex, it should be noted that while the M-values vary by tissue compartment, also two sets of M-values are used for each TC;
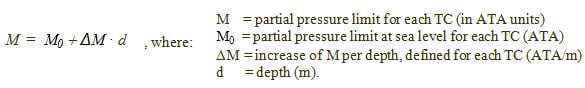
Workman defined the relationship of these different M-values as:
M = M? + ?M · d, where:
M = partial pressure limit for each TC (in ATA units)
M? = partial pressure limit at sea level for each TC (ATA)
?M = increase of M per depth, defined for each TC (ATA/m)
d = depth (m).
These sets of values are listed in literature4. However, they concern the same thing: maximum allowed overpressure of the tissue compartments.
It is also important to know, that decompression illness (DCI) does not exactly follow the M-values. More DCI occurs at and above the pressures represented by the M-values, and less sickness occurs when divers stay well below the M-values.
Become A Shearwater Power User! (eBook)
An Illustrated Guide to Gradient Factors and Advanced Shearwater Computer Settings for safe scuba diving.
42 Pages. Printable PDF format. Fully Illustrated.$9
Gradient Factors are meant to offer conservatism settings for Bühlmann’s decompression model.
As mentioned in the previous chapter, M-value line sets a limit which is not supposed to be exceeded during ascent and decompression. However, as no decompression model can positively prevent all DCS cases, and because both dives and divers are individual, additional safety margin should be applied.
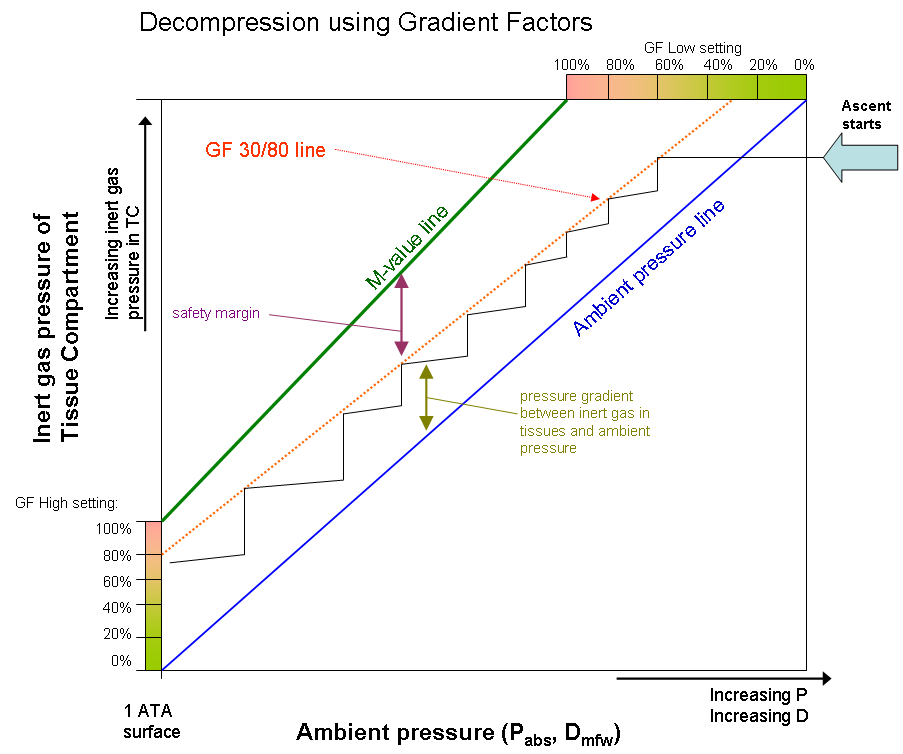
As shown in Figure 3, ascent and decompression occurs between the M-value line and Ambient Pressure line. Inert gas pressure in tissue compartments must exceed the ambient pressure to enable off-gassing. On the other hand, we do not want to go too close to the M-value line for safety reasons.
Gradient Factors define the conservatism here. The Gradient Factor defines the amount of inert gas supersaturation in leading tissue compartment.
Thus, GF 0% means that there is no supersaturation occurring and inert gas partial pressure equals ambient pressure in leading compartment (Note: The leading TC is not necessarily the fastest TC!).
GF 100% means that decompression is being done in a situation where the leading TC is at its Bühlmann’s M-value line and risk for DCS is far greater than using lower GF.
(Note: Sometimes, especially in equations and calculations, GF’s may be numbered as 0.00 … 1.00 instead of percentage. However, these are effectively the same thing as 100% = 1)
Some diver’s did not like the idea of using the same conservatism factor throughout the ascent. Instead of having one GF, there was need to change the safety margin during the ascent. This led to two GF values; “GF Low” and “GF High”.
Low Gradient Factor defines the first decompression stop, while High Gradient Factor defines the surfacing value.
Using this method, the GF actually changes throughout the ascent. This is illustrated in Figure 4, where GF Low and GF High forms start and end points to a Gradient Factor line. In that graph, decompression starts when the inert gas partial pressure in diver’s TC’s reaches 30% of the of the way between Ambient Pressure line and M-value line.
Then the diver spends time in that stop until partial pressure drops in the TC’s enough for enabling ascent to next stop, which again has a bit higher GF. These two GF values are often written as “GF Low-% / High-%”, e.g. GF 30/80, where 30% is GF Low value and 80% GF High value.
Figure 4: One-tissue model of decompression. Graph starts from top right and goes left down, staying between the ambient pressure line and Gradient Factor (GF) line.
GF line stays below the M-value line and forms the safety margin for the decompression. Pure Bühlmann decompression would follow the M-value line (GF 100/100).
Sponsored Link
PRACTICAL APPLICATIONS AND SAFE DIVING HABITS
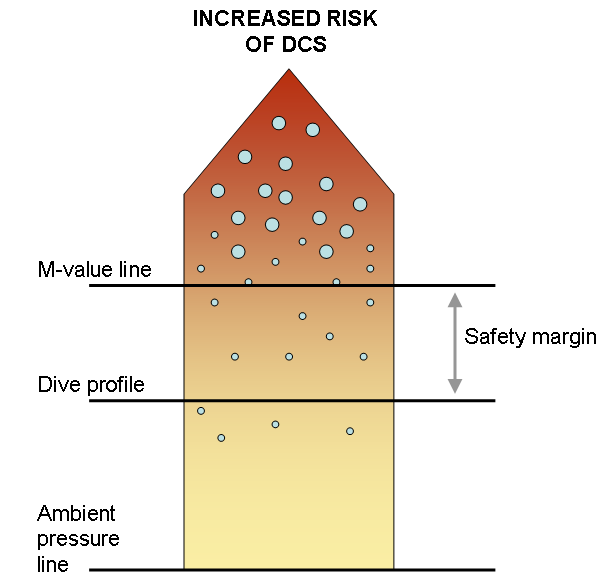
No decompression model can positively prevent divers getting hit. M-values do not represent any hard line between “no DCS symptoms” and “getting hit”.
In fact, modern decompression science has proven that there might be bubbles present in our tissues even when there are no DCS symptoms after a dive.
Therefore, M-values neither represent a bubble-free situation, but tolerable amount of “silent” bubbles in tissues.
Figure 5: Silent bubbles are present in our tissues even when no DCS symptoms are present. It is important to know personal safety margin and individual susceptibility to DCS.
It is important to understand that certain dives and different people may need different safety margins. Therefore it is good to know the practical differences between dive plans where different Gradient Factors are used. Let’s take another example:
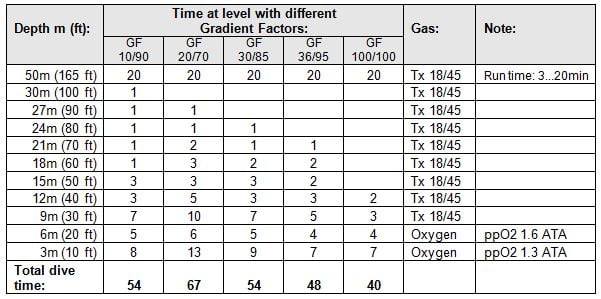
A diver goes to 50m/165ft for 20 minutes bottom time, using Trimix 18/45 (18% oxygen, 45% helium) as back gas, and oxygen for decompression from 6m (20ft) on.
Descent rate is 15m/min (50ft/min) and ascent rate is 10m/min (33ft/min). Decompression algorithm is based on Bühlmann ZH-L16B and the different decompression tables, based on five different GFs, are shown in Table 1.
Table 1: Decompression tables for 50m (165ft) / 20min using different Gradient Factors.
These GF parameters are commonly used for different types of dives (e.g. rebreather, deep/cold dives, default values in some decompression SW) and GF 100/100 is shown here as a reference, since it is pure Bühlmann table (containing no margin, so it is also not very safe!).
As clearly shown in Table 1, low GF Low numbers generate deeper stops.
In fact, some divers use GF Low value of 10% to generate “deep stops” 5.
Deep stops, also called “Pyle stops”, are a means to reduce micro-bubbles during deeper phase of ascent. However, during deep stops, many slower tissues are still on-gassing and thus total decompression time will increase (but again, safety is worth for some added hangtime!).
Small GF High values generate longer shallow stops, as also seen in Table 1.
On long decompression dives, safety margins not only contribute to preventing of DCS, but also to gas planning, logistics and equipment considerations.
A good diver adapts his/her personal Gradient Factors according to personal fitness, environment and dive type. No matter which diving gear you use, decompression and need for conservatism follows your plan!
It is easy to modify the dive plan even drastically by using different gradient factors. Most modern decompression software provides either conservatism settings (in verbal terms or numbers) or gradient factors.
A diver can modify the total dive time easily by even tens of minutes with these settings, not to mention also the decompression gas needed.
But this is also a pitfall; consider a situation where decompression software indicates that you need an intermediate decompression mix fill pressure which is just above your cylinder capacity (including margins).
Now, an easy but dangerous choice would be altering the gradient factors so that the decompression time decreases, leading to lower decompression gas need.
Divers using computers, which have user-configurable gradient factors, should understand how modifying their GF’s will affect to their decompression profiles.
Too many divers simply use the default settings or copy their GF parameters from other divers or even from the Internet, no matter what kind of a dive they are doing. Some divers have higher susceptibility to DCS and some dives are physically more demanding than others.
Although the gradient factor method provides substantial flexibility in controlling the decompression profiles and thus the dive plan and gas logistics, it just might be worth to hang there a bit longer sometimes.
As always in diving, it remains YOUR responsibility to choose the gradient factors and conservatism appropriate for you!
About the author: Matti Anttila
Matti Anttila is an engineer with a M.Sc. degree in technical physics and Ph.D. in spaceflight instrumentation, so diving science is close to his heart. He was trained as a minehunter diver in the Finnish Navy in 1995 using semi-closed rebreathers. In the late 1990’s he began teaching technical diving in Finland, and currently he is a trimix instructor trainer with IANTD, in addition to being on their Board of Advisors.by Matti Anttila,Ph.D.
GRADIENT FACTOR REFERENCES
Bert, Paul: La Pression barométrique, recherches de physiologie expérimentale, 1878
Boycott, A.E., Damant, G.C.C., and Haldane, J.S: The Prevention of Compressed Air Illness, The Journal of Medicine (Journal of Hygiene, Volume 8, (1908), pp.342-443.)
Bühlmann, Albert A.: Decompression – Decompression Sickness. Berlin:Springer-Verlag, 1984.
Understanding M-Values | Erik C. Baker Erik Baker's excellent article on 'Understanding 'M-Values'. Critical reading for prospective technical diving students.
Calculating No Stop Time for Scuba Diving Calculating No Stop Time for Scuba Diving Welcome to an informative article on "Calculating No Stop Time for Scuba Diving" written by Erik C. Baker.…
Oxygen Toxicity Dangers by Dr. E.D. Thalmann | DAN DAN discusses the dangers of oxygen toxicity when using nitrox as a breathing gas. By Dr. E.D. Thalmann, DAN Assistant Medical Director; Captain, Medical Corps,…
Technical Diving Standard Gas Mixes The technical diving standard gas mixes. These breathing gasses ensure risk mitigation and help standardize team tech diving.
Gradient Factors for Dummies Gradient Factors for Dummies by Kevin Watts An explanation of gradient factors settings on your deco software.
Oxygen Exposure Management for Scuba Divers OXYGEN EXPOSURE MANAGEMENT by Richard D. Vann Oxygen metabolism is the primary energy source in higher life forms, but when oxygen enters the metabolic process…
Compression Arthralgia | Deep Diving Maladies An overview of compression arthralgia | Hyperbaric deep diving malady | Compression arthralgia causes, symptoms, treatment | By Andy Davis